Links de passagem do livro para 1266
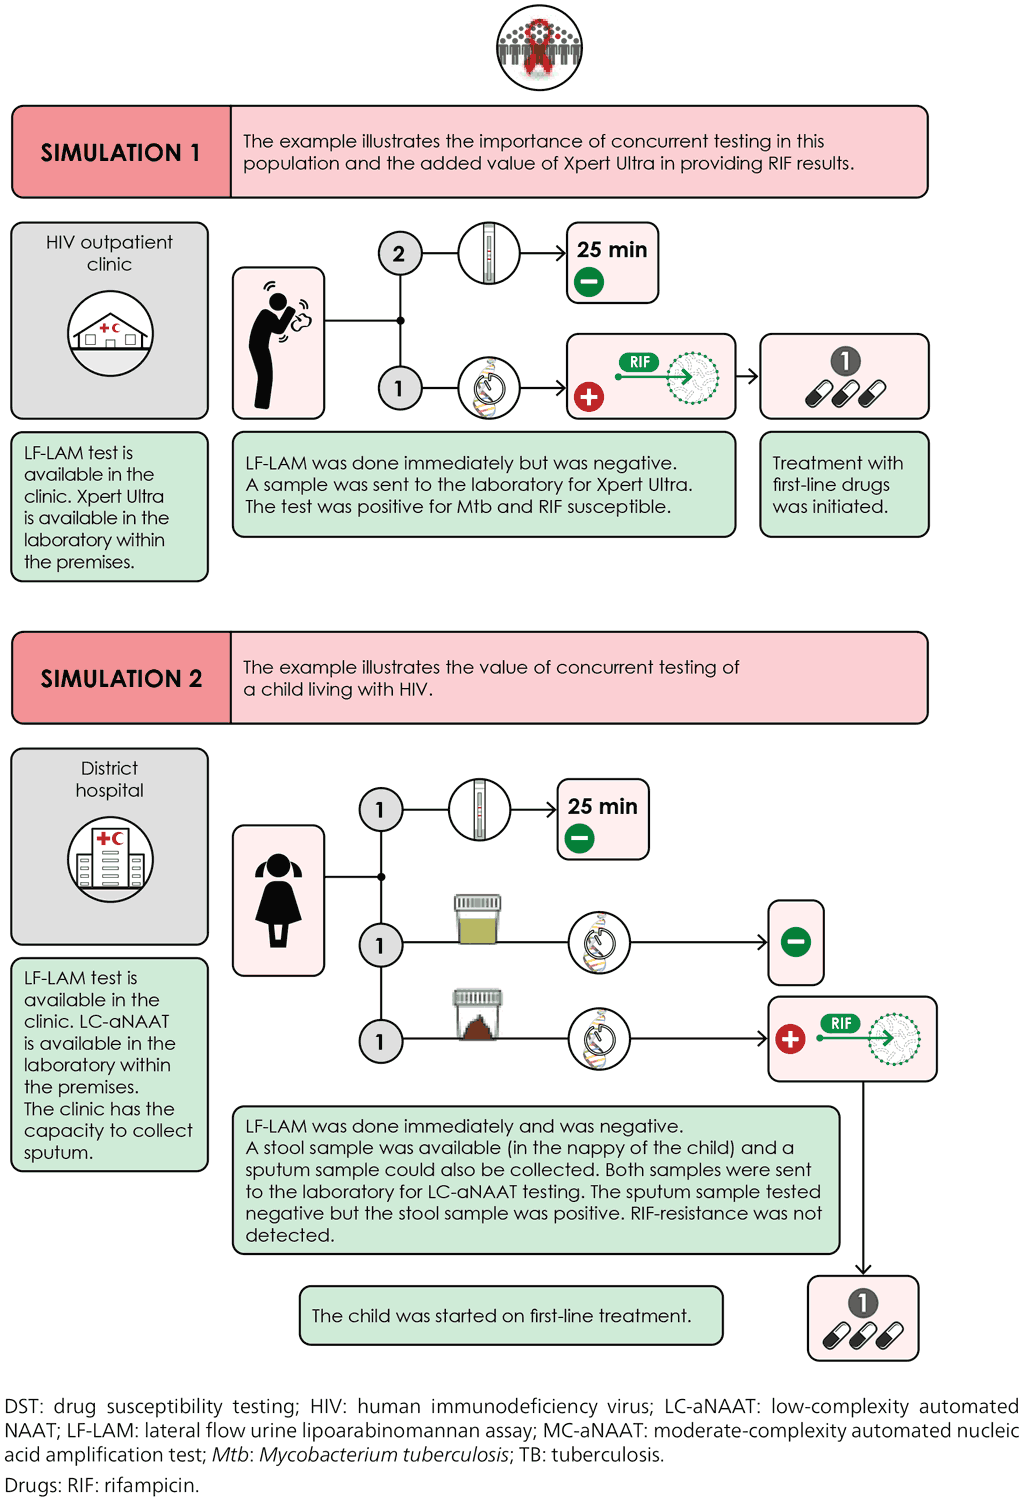
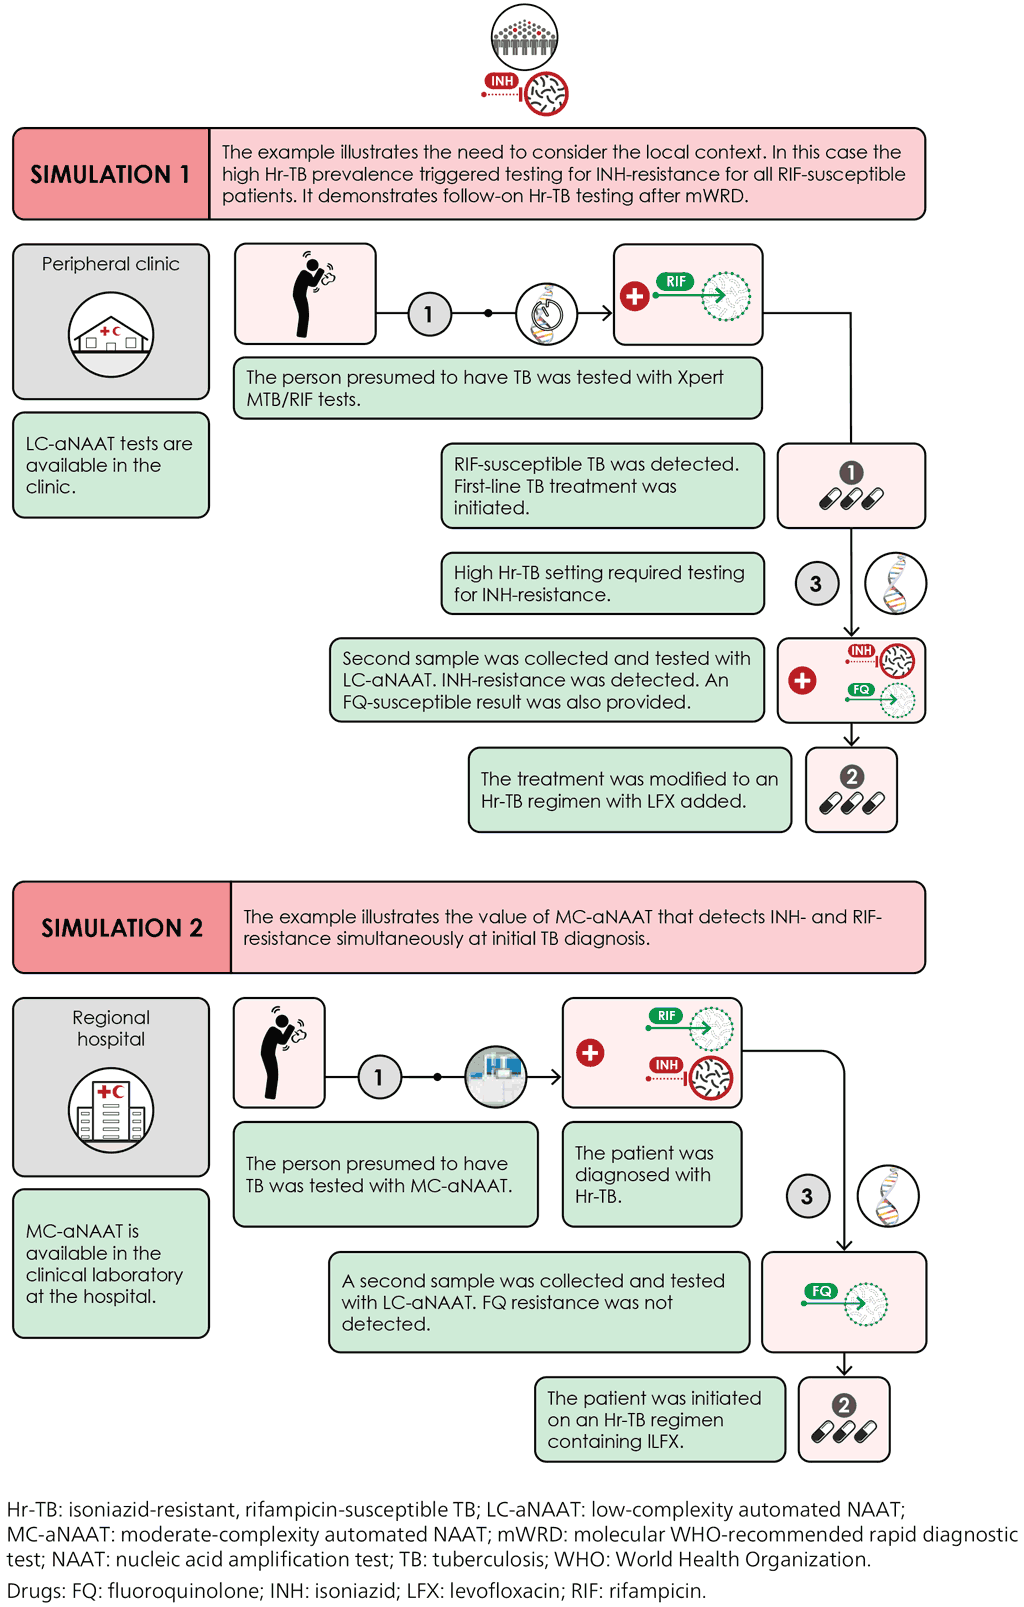
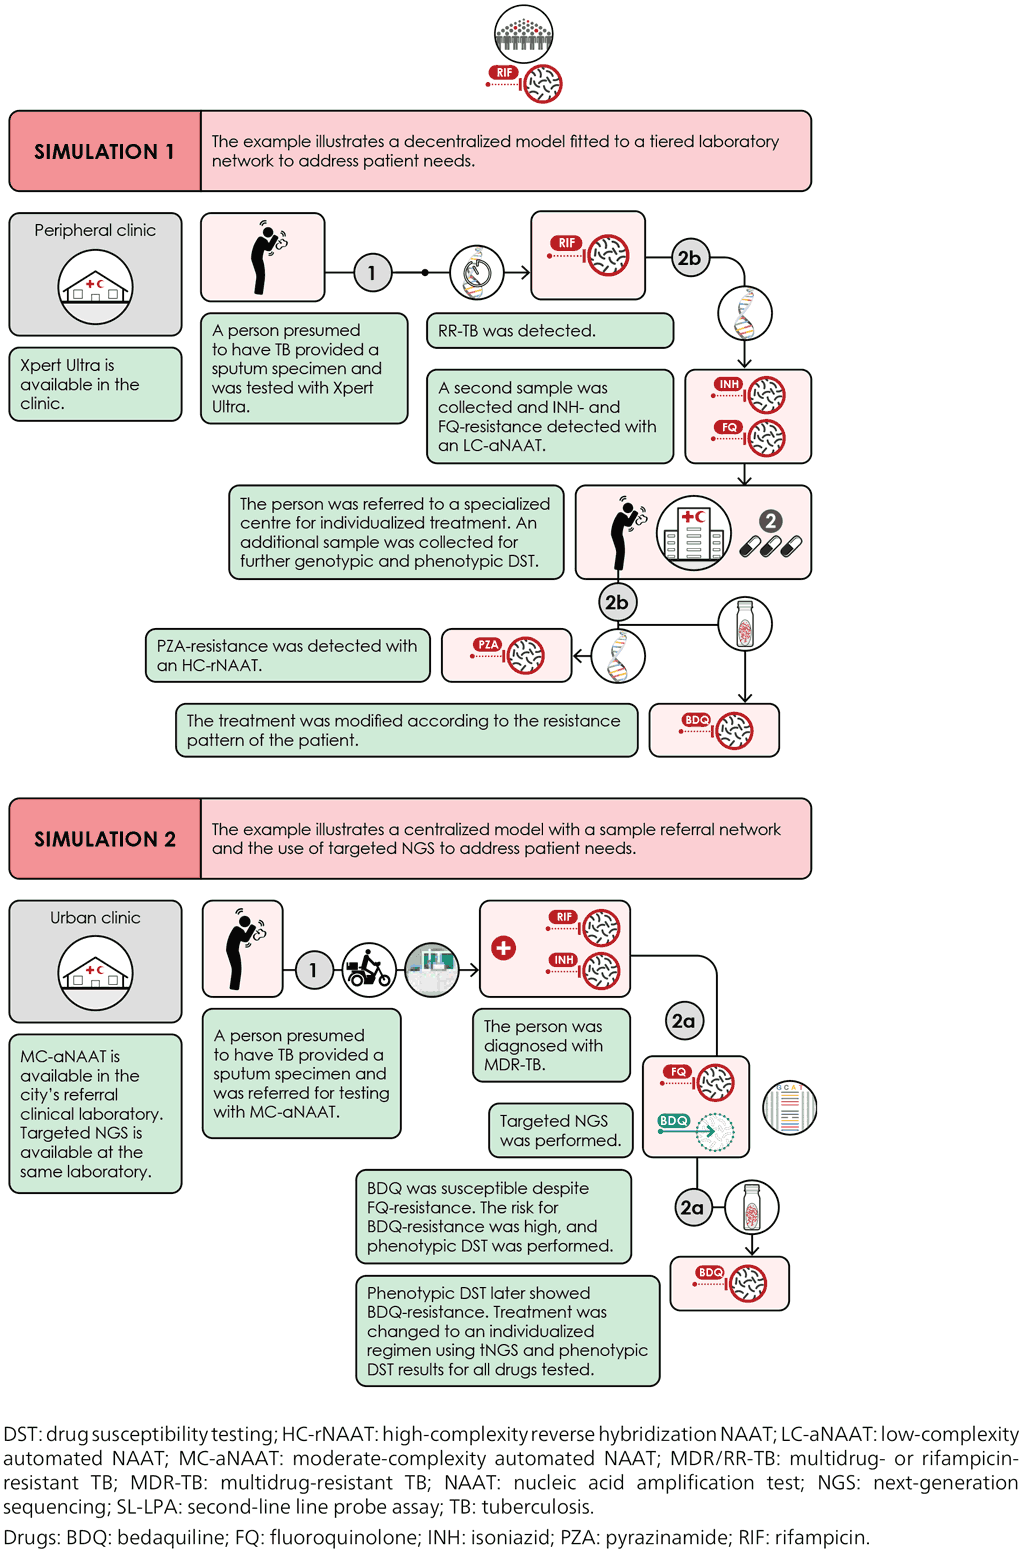
To aid understanding of how the different algorithms interlink to provide a final diagnosis for a person, illustrative scenarios are presented in Fig. 6.8, Fig. 6.9 and Fig. 6.10. Three scenarios are provided, with two simulated pathways in each. The scenarios are based on three epidemiological settings: high TB/HIV, high Hr-TB and high MDR/RR-TB. These examples are for illustrative purposes only – they do not represent a specific recommendation. There could be many alternative combinations that could achieve the same outcome; the choice to use one test instead of another would depend on factors such as availability, ease of use, in-country product support and cost.
Algorithms should be designed to use existing laboratory services and networks, so that specimens can be referred to the appropriate level for tests that are not available at peripheral-level laboratories.
Fig. 6.8. Scenario 1: High TB/HIV setting

Fig. 6.9. Scenario 2: High Hr-TB setting

Fig. 6.10. Scenario 3: High MDR/RR-TB setting


 Opinião