Enlaces transversales de Book para 1266
The predictive values of a test vary depending on the prevalence of TB in the population being tested. The prevalence of TB in a country is best estimated through a national TB prevalence survey. Countries should conduct prevalence surveys about every 10 years. If a survey has not been conducted recently, WHO provides estimates of prevalence in its annual global TB report (2). These estimates are based on the number of notified TB cases submitted each year by Member States. However, the number of notified cases is not a good proxy for the actual number of people who develop TB disease. Both underreporting of diagnosed TB (especially in the private sector) and underdiagnosis (especially in countries with geographical or financial barriers to seeking and accessing health care) will affect the reported numbers and thus the estimates. Also, figures provided by WHO are national, and regional variations in prevalence may warrant the use of different tests in different regions.
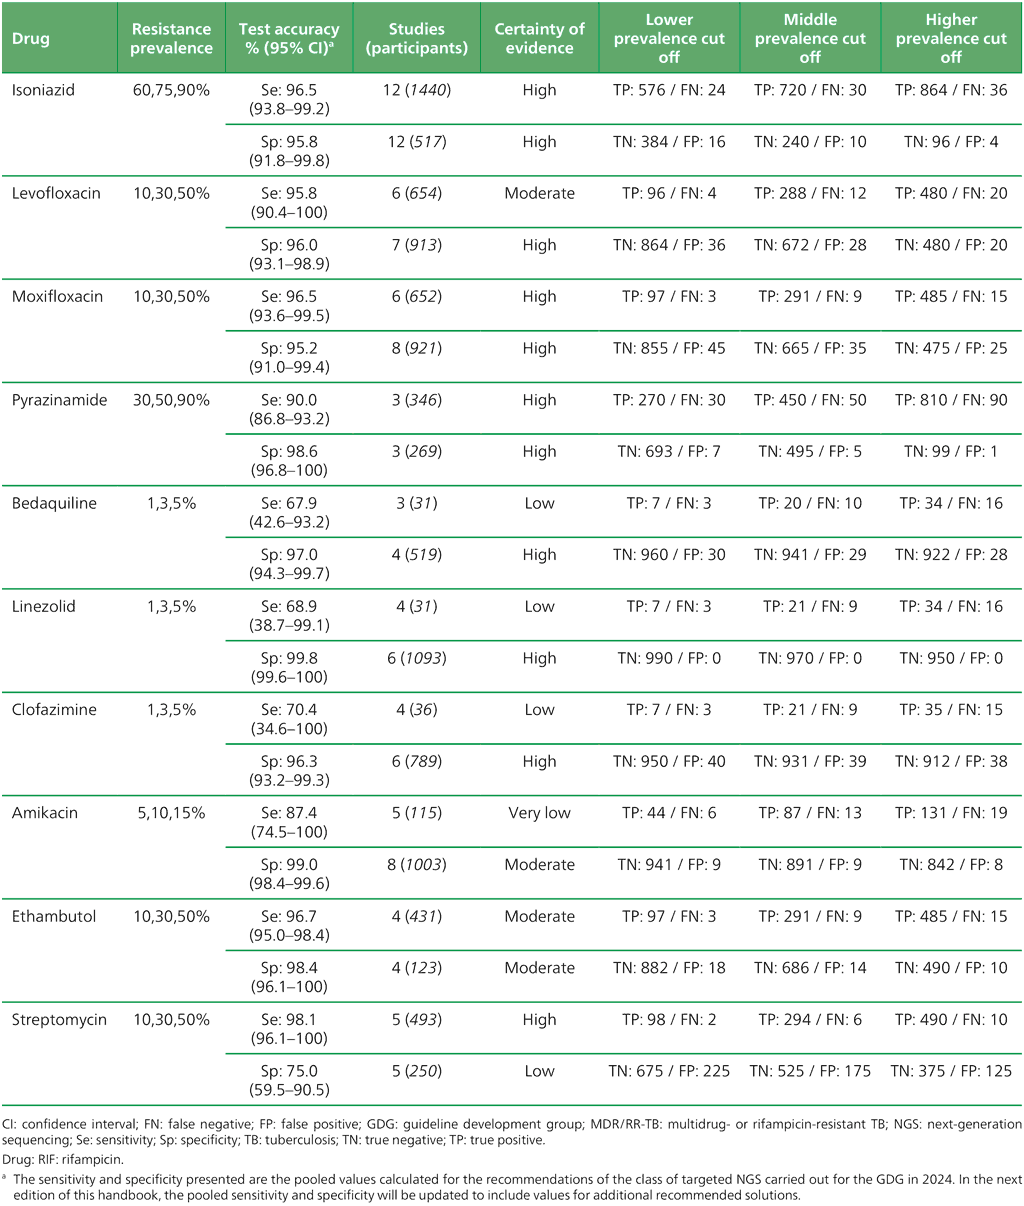
Table 3.1 provides examples of population-level projections of the results of testing with automated NAATs (low complexity and moderate complexity) and manual NAATs (low complexity) in settings with different levels of TB prevalence, based on pooled sensitivity and specificity estimates that were extracted from the WHO consolidated guidelines on tuberculosis: module 3: diagnosis (5). Table 3.2, Table 3.3 and Table 3.4 provide those same parameters for detection of resistance to RIF, INH and FQs, respectively. Table 3.5 and Table 3.6 provide the parameters for detection of resistance to first-line and second-line anti-TB agents using targeted NGS end-to-end solutions and tests. The sensitivity of the test may be lower when used for active case-finding in a population-screening context because such people would be less ill and have a lower bacillary burden. In choosing a test to implement, each country will need to consider the possible trade-offs between higher or lower sensitivity and higher or lower specificity, based on the prevalence of TB in their country (Box 3.1). False negative results may lead to missed opportunities to treat TB, whereas false positive results may lead to the overtreatment of people who do not have TB. In some settings, countries may need to conduct additional modelling work to support decisions on implementation strategies, based on the trade-offs between sensitivity and specificity in their settings.
In addition to geographical variability, differences in the approach to screening for TB disease may also affect the predictive value of TB testing. Usually, a decision to undertake a diagnostic work-up of an individual for TB begins with assessing symptoms and signs of TB disease. However, many individuals with culture-positive TB may not have symptoms or may consider the symptoms too insignificant to report, leading to missed opportunities for diagnosis. To improve TB case detection and identify individuals suitable for TPT, WHO has updated the TB screening guidelines (54). Several modalities are recommended for screening all people for TB, including the four-symptom screen, CXR (Box 3.2) and mWRDs; for screening of people living with HIV, additional testing for positive C-reactive protein testing (>5 mg/L) may be considered.
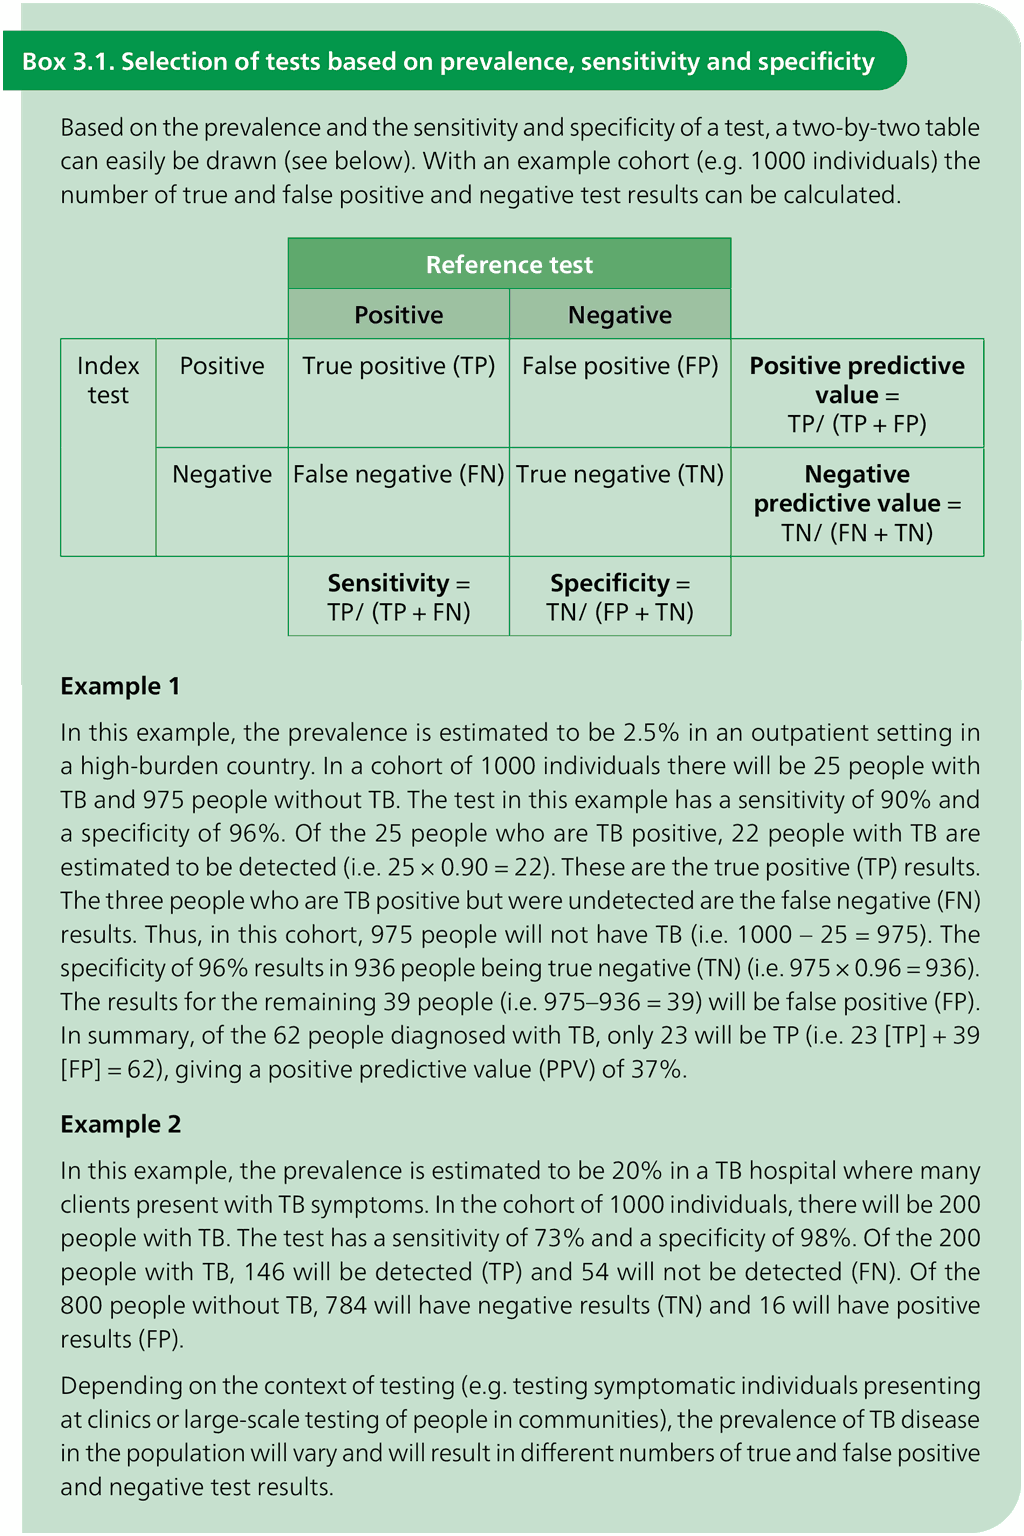
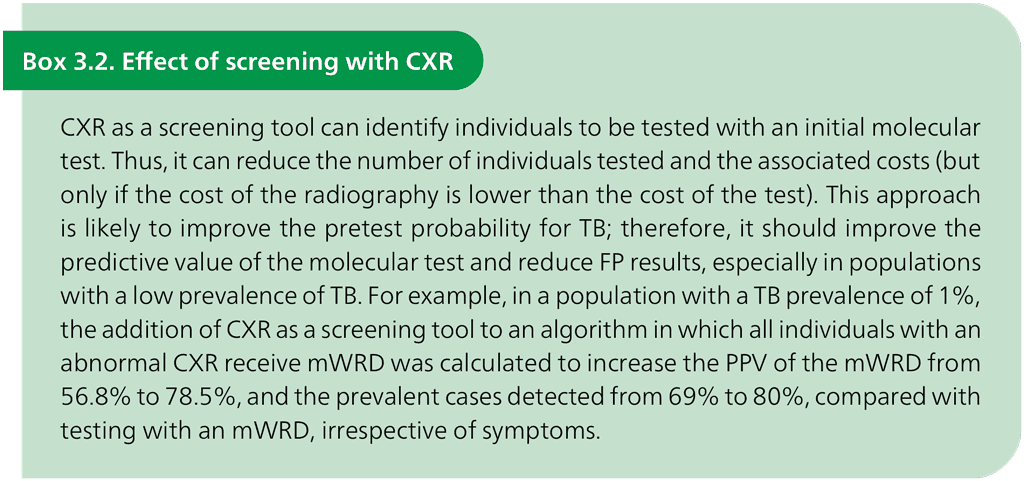
Table 3.1. Performance of mWRDs for the detection of TB in adults with signs and symptoms being evaluated for pulmonary TB compared with a microbiological reference standard (absolute number of TP, FP, TN or FN, under a given prevalence out of 1000)
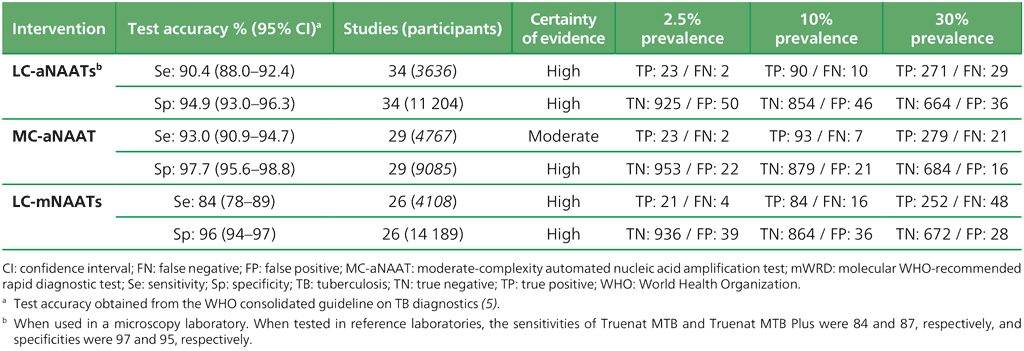
Table 3.2. Performance of molecular tests for the detection of RIF resistance in adults with signs and symptoms being evaluated for pulmonary TBᵃ compared with a microbiological reference standard (absolute number of TP, FP, TN or FN, under a given prevalence of RIF resistance out of 1000)

Table 3.3. Performance of molecular tests for the detection of INH resistance in adults with detected pulmonary TBᵃ compared with a microbiological reference standard (absolute number of TP, FP, TN or FN, under a given prevalence of INH resistance out of 1000)
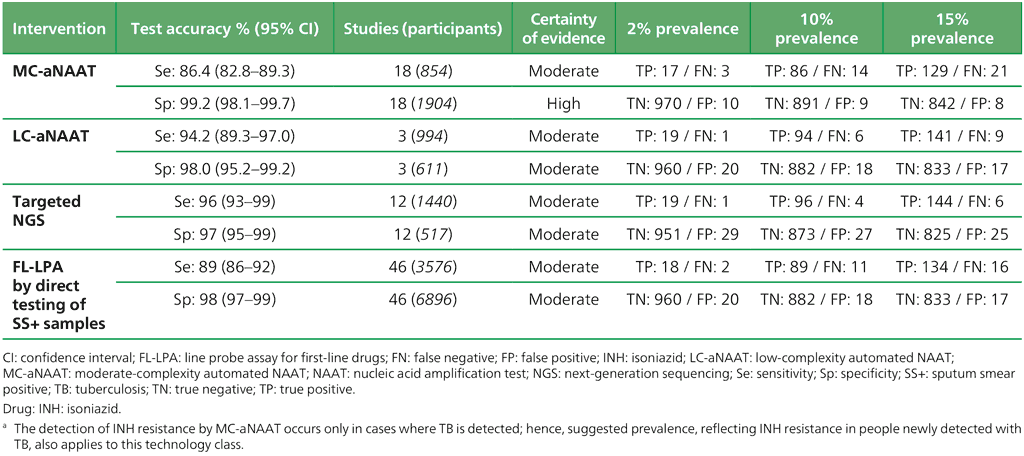
Table 3.4. Performance of molecular tests for the detection of FQ resistance in adults with detected pulmonary TB compared with a microbiological reference standard (absolute number of TP, FP, TN or FN, under a given prevalence of FQ resistance out of 1000)
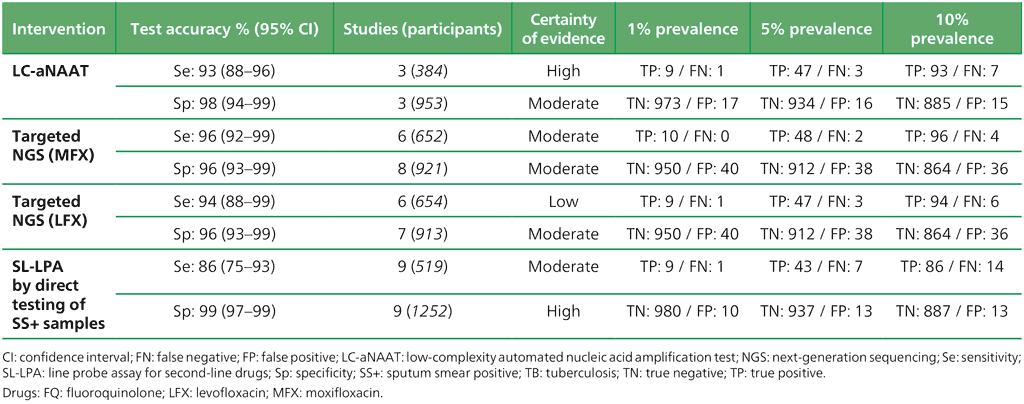
Table 3.5. Performance of molecular tests for the detection of resistance to other first-line anti-TB medicines in adults with detected pulmonary TB compared with a microbiological reference standard (absolute number of TP, FP, TN or FN, under a given prevalence of resistance out of 1000)
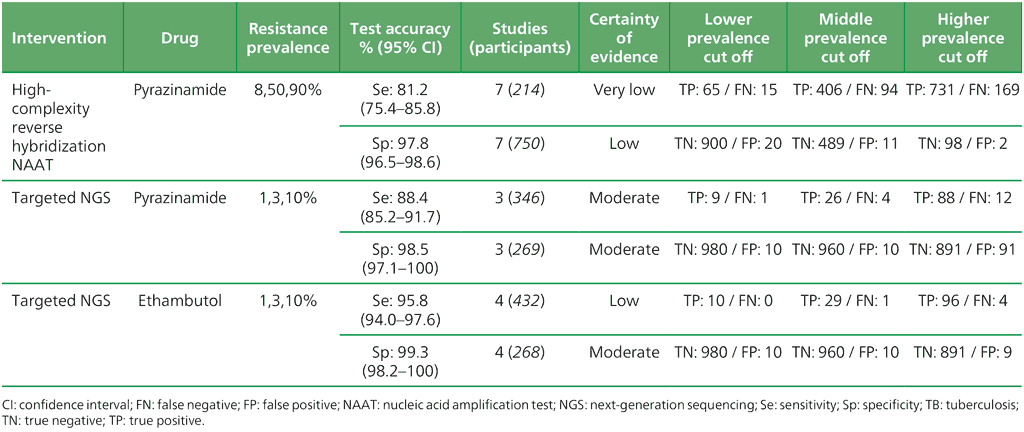
Table 3.6. Performance of targeted NGS for the detection of resistance to anti-TB medicines used to treat MDR/RR-TB in adults with bacteriologically confirmed RIF-resistant pulmonary TB compared with a microbiological reference standard (absolute number of TP, FP, TN or FN, under a given prevalence of resistance out of 1000)

 Reacción