Book traversal links for 1266
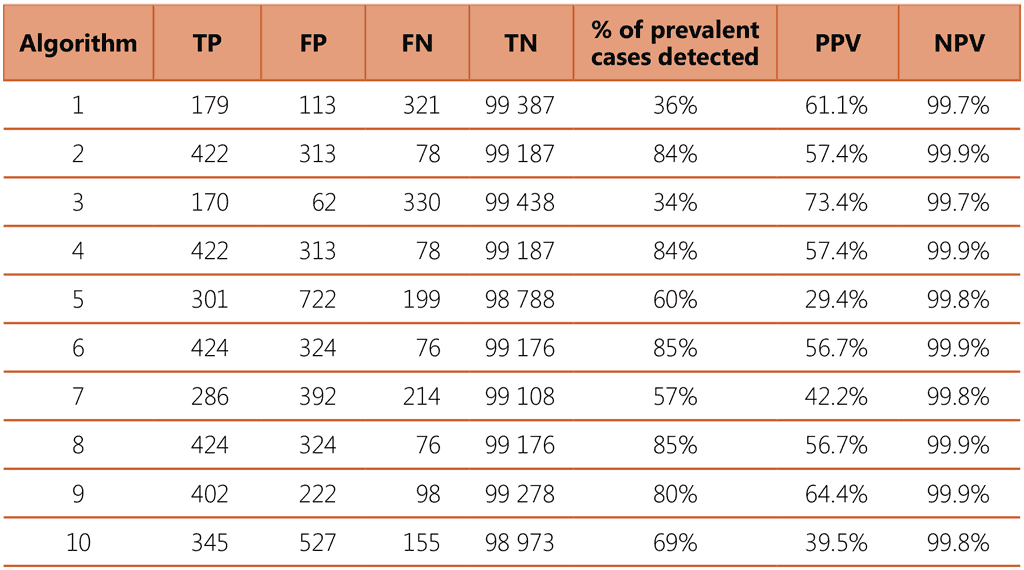
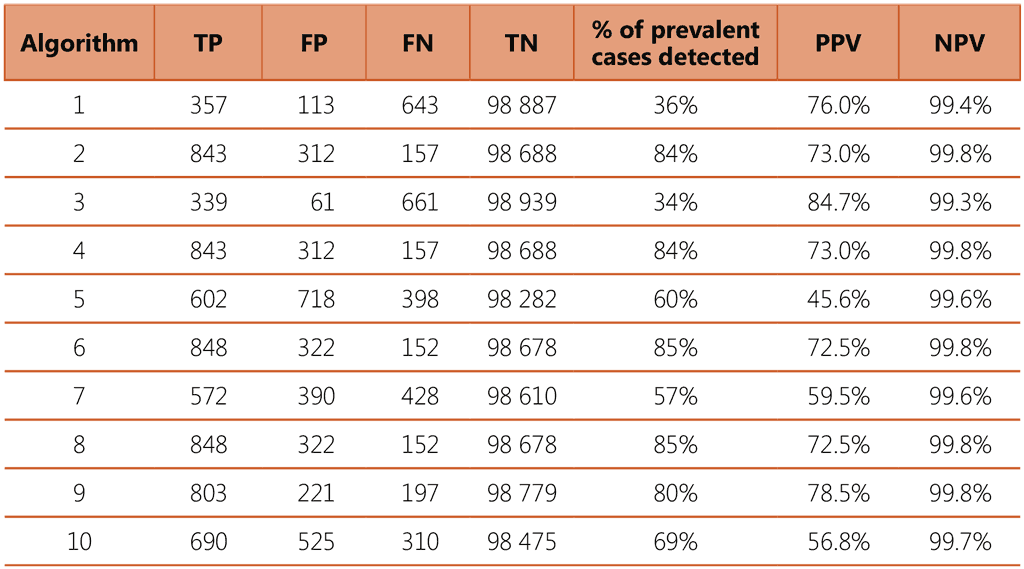
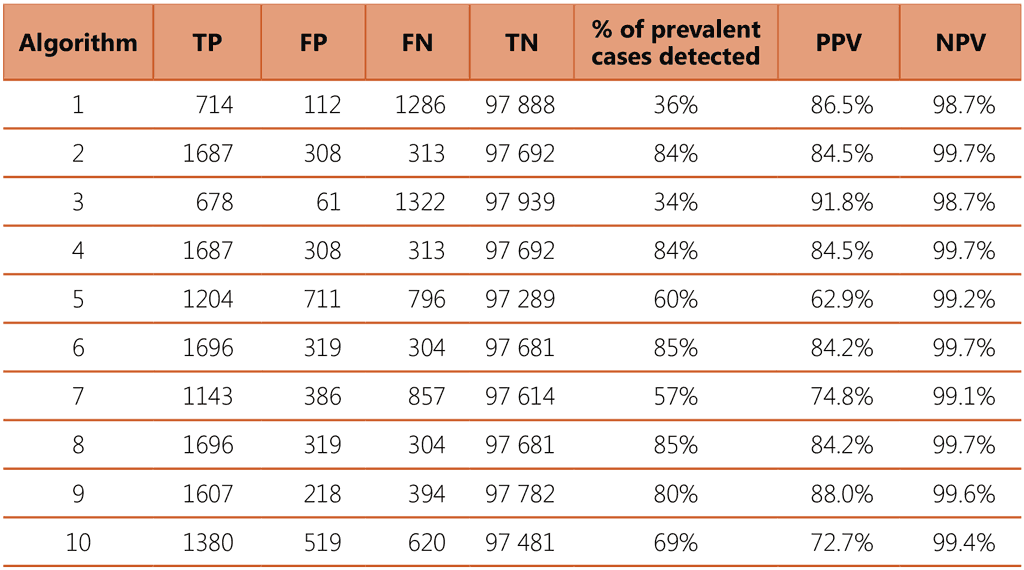
The tables below contain modelled estimates of the performance and outcomes of the 10 screening algorithms described above, when applied to a population of 100,000 people being screened, across three different TB prevalence settings: 0.5%, 1% and 2%.
1 – Screening with cough
2 – Parallel screening with cough and CXR
3 – Sequential positive serial screening with cough and CXR
4 – Sequential negative serial screening with cough and CXR
5 – Screening with any TB symptom
6 – Parallel screening with any TB symptom and CXR
7 – Sequential positive serial screening with any TB symptom and CXR
8 – Sequential negative serial screening with any TB symptom and CXR
9 – Screening with CXR followed by mWRD
10 – Screening with mWRD followed by diagnostic exam (consisting of repeated mWRD, CXR, other clinical tests and procedures as indicated)
Table A.2.1 100 000 people screened with 0.5% TB prevalence (with 500 prevalent TB cases)

Table A.2.2 100 000 people screened with 1% TB prevalence (with 1000 prevalent TB cases)

Table A.2.3 100 000 people screened with 2% TB prevalence (with 2000 prevalent TB cases)


 Feedback